Virtual Library
Start Your Search
Kazuhiro Kakimi
Author of
-
+
MA19 - Genomic Markers of IO Response (ID 922)
- Event: WCLC 2018
- Type: Mini Oral Abstract Session
- Track: Immunooncology
- Presentations: 1
- Moderators:
- Coordinates: 9/25/2018, 15:15 - 16:45, Room 201 BD
-
+
MA19.05 - Difference of Tumor Mutational Burden Is Associated with Distinct Immune Microenviroment in the T Cell-Inflamed Lung Adenocarcinoma (ID 13495)
15:40 - 15:45 | Author(s): Kazuhiro Kakimi
- Abstract
- Presentation
Background
PD-L1 expression on tumor cells, tumor infiltrating lymphocytes (TILs), and tumor mutational burden (TMB) have been reported as predictive biomarkers for checkpoint inhibitor immunotherapies. However, little is known about the relationship between each biomarkers. The aim of this study was to assess the relationship between these biomarkers, especially TIL and TMB.
a9ded1e5ce5d75814730bb4caaf49419 Method
RNA-seq data of 533 primary lung adenocarcinoma were downloaded from The Cancer Genome Atlas (TCGA). Gene expression and gene set enrichment were analyzed. Clinical information and somatic missense mutation data were also integrated.
4c3880bb027f159e801041b1021e88e8 Result
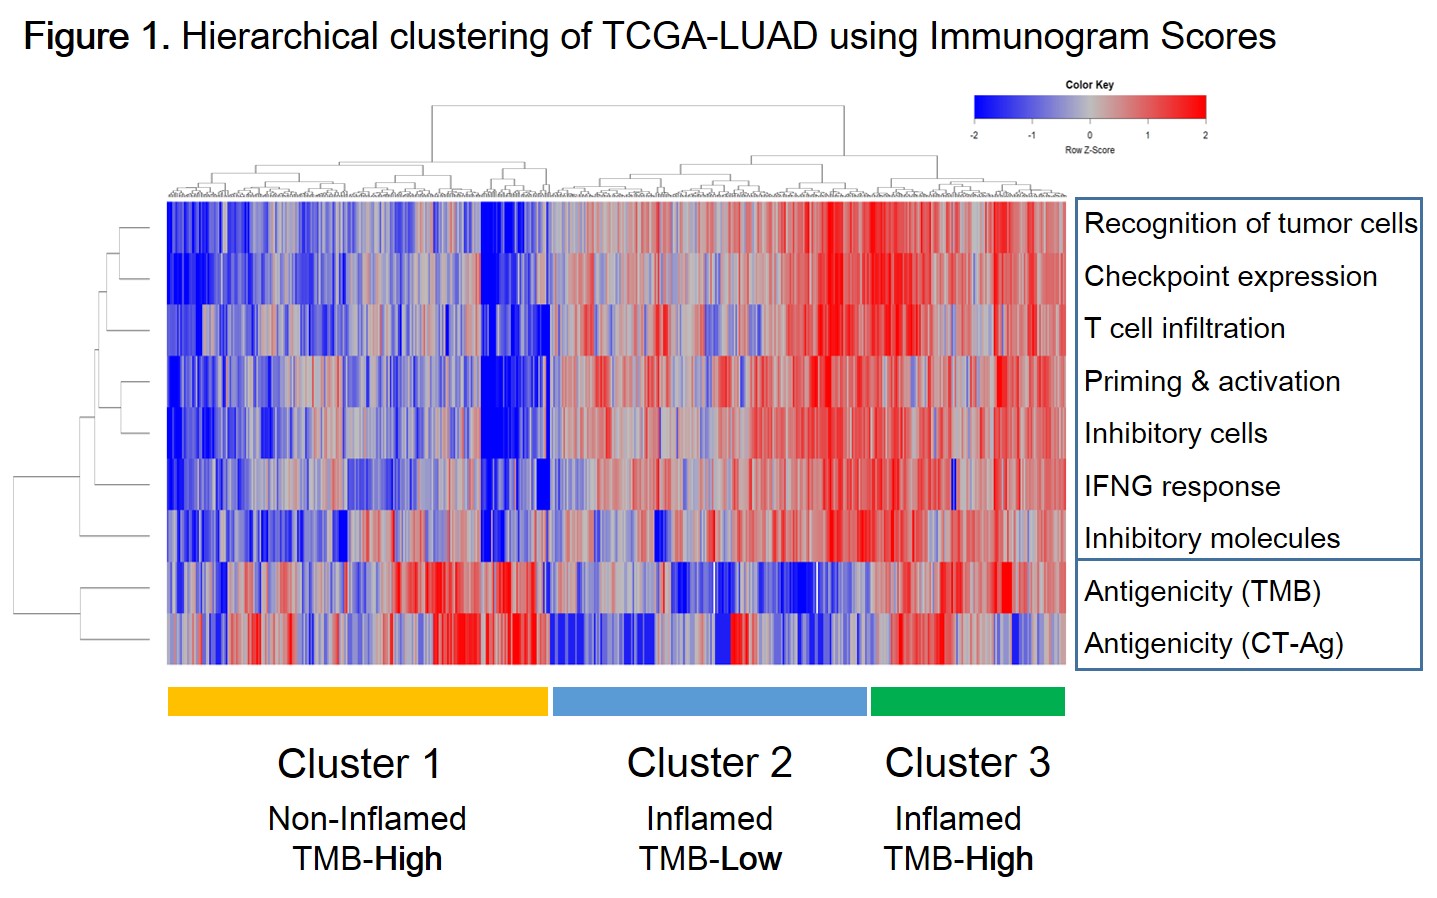
Weak correlation between PD-L1 and CD8A expression (Spearman’s R=0.32, P<0.001), and PD-L1 expression and TMB (R=0.10, P=0.019) were seen, but not between CD8A expression and TMB (R=0.03, P=0.45). Next, we performed gene signature analysis related to cancer-immunity cycle (ref. Karasaki et al. J Thorac Oncol 2017). Hierarchical clustering resulted in 3 clusters: T cell non-inflamed phenotype with high antigenicity (Cluster 1), inflamed phenotype with low antigenicity (Cluster 2), and inflamed phenotype with high antigenicity (Cluster 3).(Fig.1) Compared with Cluster 3, Cluster 2 was featured by lower gene expression signature of cytolytic activity (P<0.0001, U-test), as well as lower expression of PD-L1 (P<0.0001, U-test).
To further investigate the relationship between TMB and TILs, T-cell inflamed phenotype tumors were divided into four groups according to the quartiles of TMB. We estimated immune cell phenotypes of TMB-high (upper quartile) and TMB-low (lower quartile) groups using ssGSEA and CIBERSORT. Either analysis showed significant enrichment of activated CD4 T cells in TMB-high group (P<0.0001, T-test).
8eea62084ca7e541d918e823422bd82e Conclusion
Existence of Cluster 1 and 2 suggested that tumor antigenicity (TMB) does not necessarily correlate with TIL enrichment. TMB-low tumors may form T cell-inflamed tumors (Cluster 2), although the immune status may differ from TMB-high inflamed tumors (Cluster 3). Integrating multiple biomarkers for the assessment of tumor immune microenvironment is important for optimal immunotherapy.
6f8b794f3246b0c1e1780bb4d4d5dc53
Only Members that have purchased this event or have registered via an access code will be able to view this content. To view this presentation, please login, select "Add to Cart" and proceed to checkout. If you would like to become a member of IASLC, please click here.


